Table of Contents
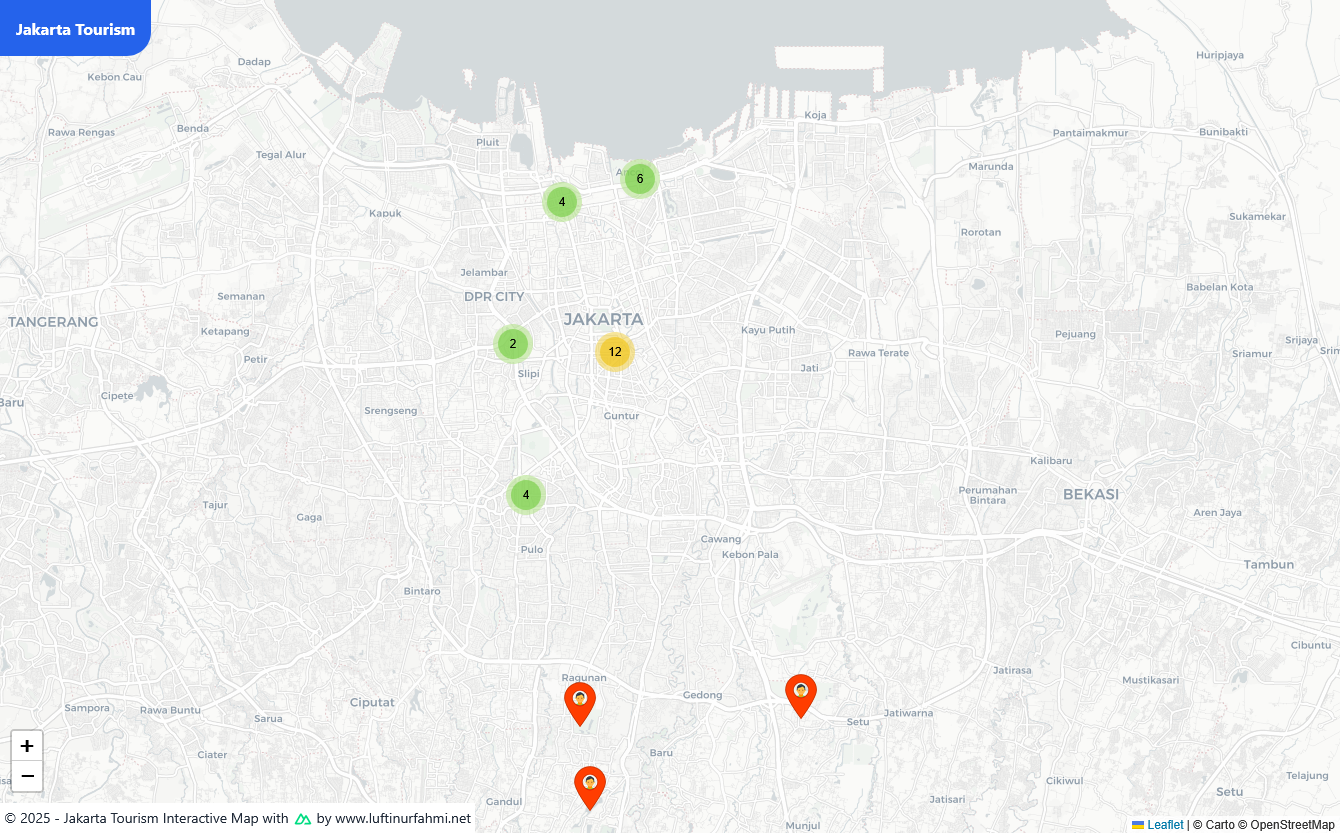
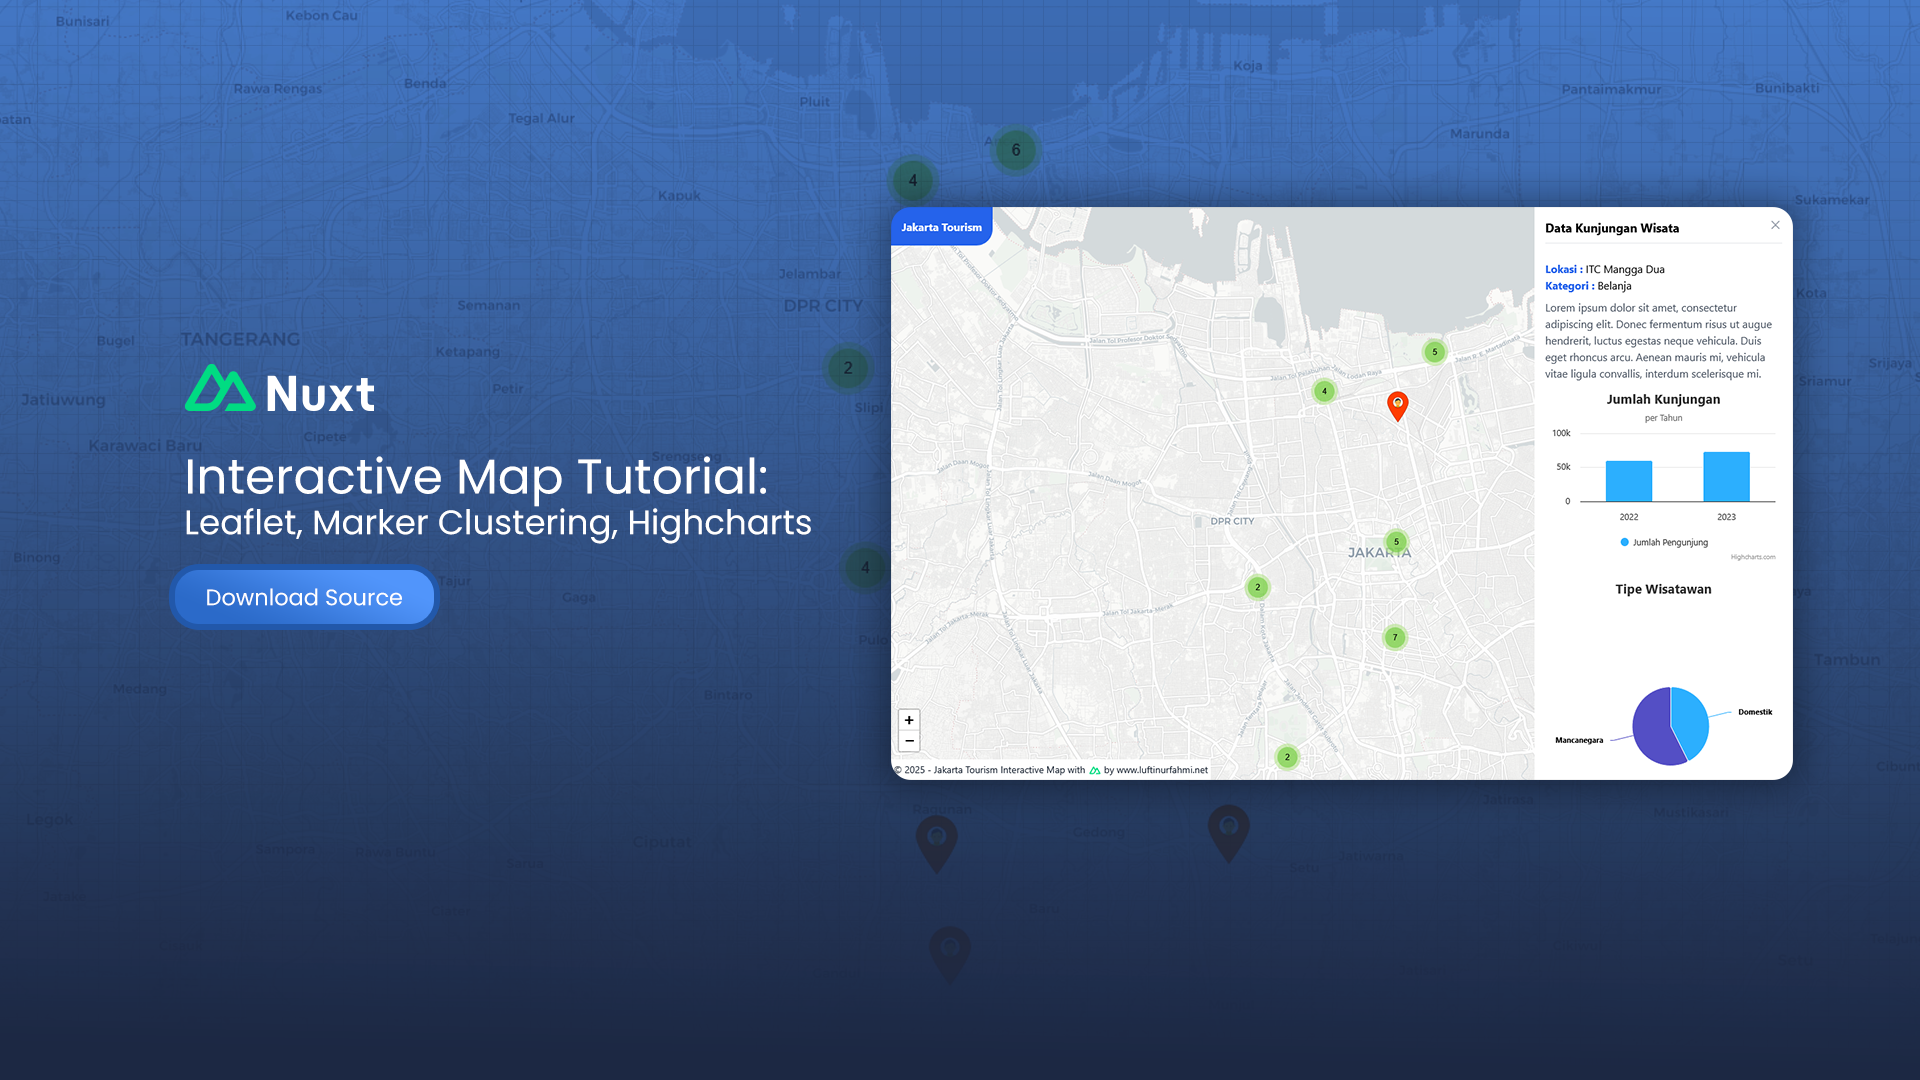
Lately, I’ve been experimenting with Nuxt 4, trying to explore its capabilities for building interactive web applications. One of my experiments led me to create a fully interactive map of Jakarta, complete with clustered markers, custom popups, and embedded charts. This tutorial walks through how I built it using Nuxt 4, Leaflet, Leaflet.markercluster, and Highcharts.
Live Demo: interactive-map-nuxt.vercel.app
Source Code: GitHub Repository
Tech Stack
- Nuxt 4 – modern Vue framework with TypeScript support.
- Tailwind CSS – for fast, responsive styling.
- Leaflet – library for interactive maps.
- Leaflet.markercluster – for automatic clustering of markers.
- Highcharts – for charts inside popups/offcanvas.
Project Setup
Start by creating a new Nuxt 4 project:
npx nuxi init interactive-map-nuxt
cd interactive-map-nuxt
npm install
Install the required dependencies:
npm install leaflet leaflet.markercluster highcharts @nuxtjs/tailwindcss
Configure nuxt.config.ts:
export default defineNuxtConfig({
  modules: ['@nuxtjs/tailwindcss'],
  css: [
    'leaflet/dist/leaflet.css',
    '@/assets/css/main.css'
  ],
  devtools: { enabled: true },
})
Folder Structure
interactive-map-nuxt/
├─ app/
│  ├─ layouts/
│  │  └─ default.vue
│  ├─ pages/
│  │  └─ index.vue
│  └─ composables/
│     └─ useJakartaMap.ts
├─ assets/css/main.css
└─ public/jakarta.json
Creating the Map
<template>
  <div ref="mapContainer" class="fixed inset-0 z-0"></div>
</template>

<script setup lang="ts">
import { ref, onMounted } from 'vue';

const mapContainer = ref<HTMLDivElement | null>(null);

onMounted(async () => {
  if (!mapContainer.value) return;

  const L = await import('leaflet');

  const map = L.map(mapContainer.value, {
    center: [-6.2088, 106.8456], // Jakarta
    zoom: 12,
    minZoom: 11,
    maxZoom: 18,
    scrollWheelZoom: true,
  });

  L.tileLayer('https://{s}.basemaps.cartocdn.com/light_all/{z}/{x}/{y}{r}.png', {
    attribution: '© Carto © OpenStreetMap',
    subdomains: 'abcd',
    maxZoom: 19,
  }).addTo(map);
});
</script>
Adding Markers & Clustering
import 'leaflet.markercluster';

const markers = L.markerClusterGroup();

data.features.forEach((feature) => {
  const [lng, lat] = feature.geometry.coordinates;
  const marker = L.marker([lat, lng]);
  marker.bindPopup(`<b>${feature.properties.name}</b><br>${feature.properties.category}`);
  markers.addLayer(marker);
});

map.addLayer(markers);
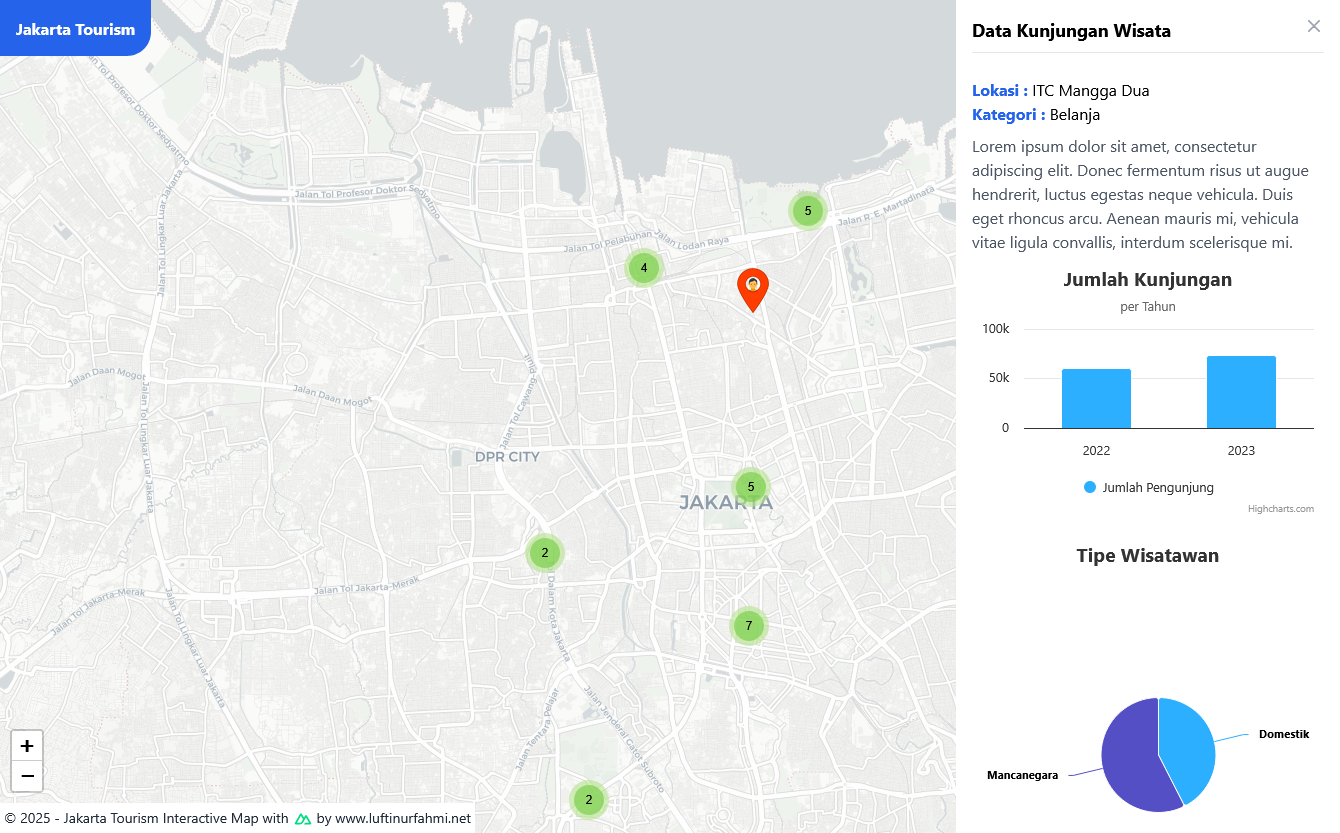
Custom Popups / Offcanvas
<div v-if="dialog.visible"
     class="absolute bg-white shadow-lg rounded-lg p-4 w-64 transition-all duration-200"
     :style="{ top: dialog.y + 'px', left: dialog.x + 'px' }">
  <h3 class="font-bold text-lg">{{ dialog.data?.name }}</h3>
  <p class="text-sm text-gray-600">Category: {{ dialog.data?.category }}</p>
  <ul class="list-disc ml-4 text-sm">
    <li v-for="(val, year) in dialog.data?.visitors" :key="year">
      {{ year }}: {{ val.toLocaleString() }}
    </li>
  </ul>
  <button @click="dialog.visible = false" class="mt-3 text-sm text-blue-600 hover:underline">
    Close
  </button>
</div>
Integrating Highcharts
import Highcharts from 'highcharts';

Highcharts.chart('chart-container', {
  chart: { type: 'pie', height: 200 },
  title: { text: 'Visitors Breakdown' },
  series: [{
    name: 'Visitors',
    data: [
      { name: 'Domestic', y: feature.properties.visitors['2023'] * 0.7 },
      { name: 'International', y: feature.properties.visitors['2023'] * 0.3 }
    ]
  }]
});
Custom Marker Icons
const icon = L.icon({
  iconUrl: '/marker-icon.png',
  iconSize: [25, 41],
  iconAnchor: [12, 41]
});

L.marker([lat, lng], { icon }).addTo(map);
Deployment
npm run build
npm run preview
Then deploy to Vercel. Preview: https://interactive-map-nuxt.vercel.app/
Conclusion
This experiment taught me a lot about Nuxt 4, Leaflet, and integrating charts in an interactive map. You now have a fully functional map with:
- Marker clustering
- Tailwind-styled custom popups
- Highcharts visualizations
- Responsive and interactive map layout
You can expand this tutorial to other cities, datasets, or even real-time data visualization.